OpenSAR Insight
From space to action: AI-powered satellites detecting floods, dark vessels, and radio interference instantly
SAR imagery
This dataset uses Synthetic Aperture Radar (SAR) images from the European Space Agency's (ESA) Copernicus Sentinel-1 mission, which come from two satellites (Sentinel-1A and Sentinel-1B) in polar orbit that operate in all weather conditions, both day and night. The selected Level 1 SAR products are Ground Range Detection (GRD) in wide interferometric mode (IW) and Single Look Complex (SLC) burst products.
The two available polarisation channels (VV and VH) have been exploited from these data, taking into account that VH (vertical-horizontal) polarisation is usually more conducive to ship detection. This is because it provides greater contrast between vessels and marine clutter. In contrast, VV (vertical-vertical) polarisation provides more information about the characteristics of the sea surface.
An important new feature of this dataset is the availability of Level 0 data (L0, RAW data) extracted from the Level 1 data (L1) used.
SAR images location
The SAR data composing the database have the following geographical coverage:
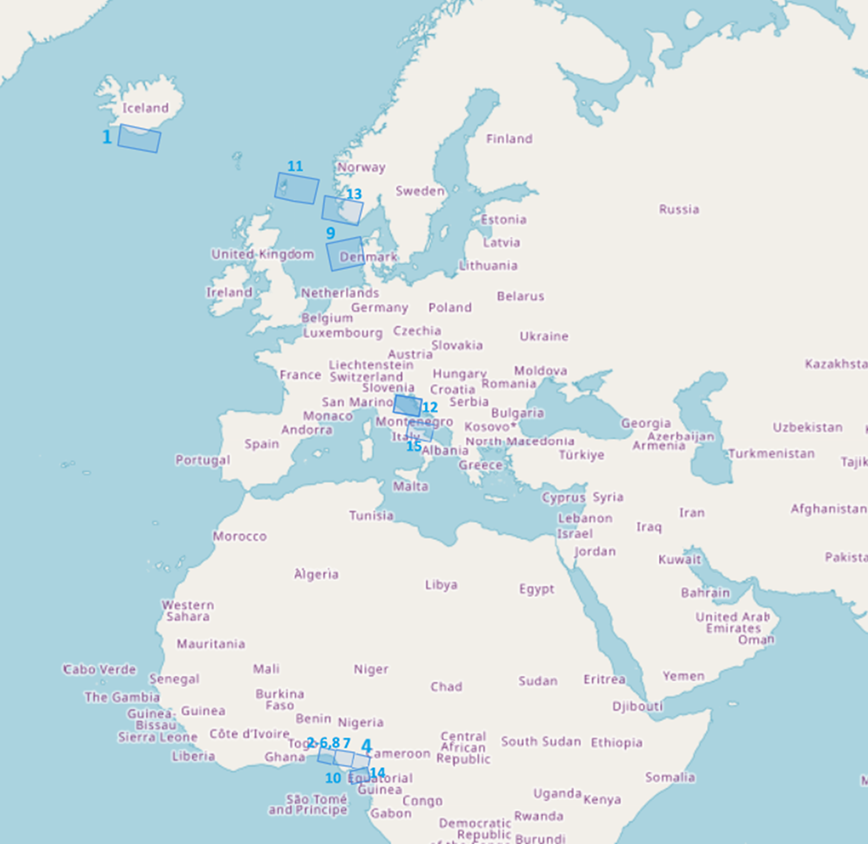
| Product ID | Location |
|---|---|
| Scene 1 | Iceland |
| Scene 2-Scene 8 | Gulf of Guinea |
| Scene 9 | Denmark |
| Scene 10 | Gulf of Guinea |
| Scene 11 | Open sea (North of UK) |
| Scene 12 | San Marino (Italy) |
| Scene 13 | South of Norway |
| Scene 14 | Malabo island (South of Africa) |
| Scene 15 | Foggia (Italy) |
SAR Data & labeling
The dataset is structured as a series of SAR scenes. In this case study, a total of 15 different SAR scenes were selected. For each Level 1 SAR product (GRD-SLC), the corresponding Level 2 Ocean products (OCN) were retrieved, allowing additional information on wind conditions over the sea surface to be included. This information has been used to complement that provided by the AIS (Automatic Identification System) data available in the xView3 reference database.
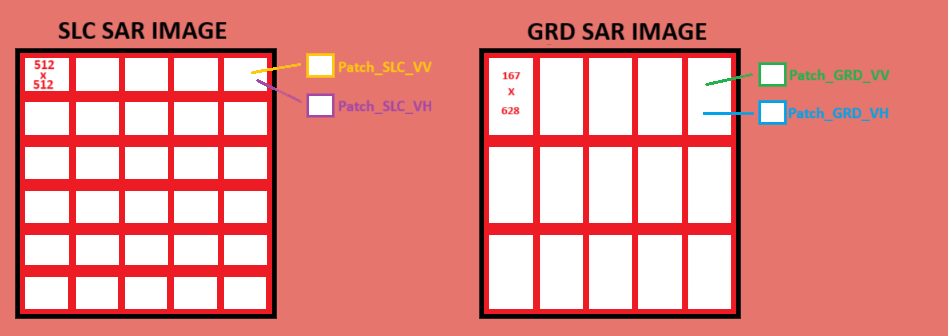
All SAR L1B products employed in this dataset were preprocessed to enable block-wise partitioning. The partitioning algorithm operates by segmenting the complex image (SLC) into non-overlapping blocks of 512 × 512 pixels, thereby producing square patches suitable for subsequent training and validation tasks. Corresponding patches were also extracted from the GRD products, ensuring spatial co-registration and alignment with the SLC-derived patches over the same geographic area of interest. Consequently, a total of four co-registered patches were obtained for each selected block region.
The labelling strategy is based on XML (Extensible Markup Language) format. In the next table are detailed the considered tags, levels, and descendants for all Dark Vessel Detection files (including metadata, data, and labels).
| Level | Tag Name | Descendants | Tag Contents |
|---|---|---|---|
| 0 | Scene_Info | Scene_ID; Date; Version; CaseStudy | - |
| 1 | Scene_ID | N/A | Naming of the SAR scene into the database |
| 1 | Date | N/A | YYYYMMDD |
| 1 | Version | N/A | Version of the SAR scene |
| 1 | CaseStudy | N/A | DarkVesselDetection |
| 0 | SARData | SAR_Mission; SAR product; SLCSwath; Time_interval | - |
| 1 | SAR_Mission | N/A | S1A-S1B |
| 1 | SARProduct | N/A | Name of the SLC product SAR |
| 1 | SLCSwath | N/A | Number of swath |
| 1 | Time_Interval | Start; Stop | - |
| 2 | Start | N/A | YYYYMMDD_HHMMSS |
| 2 | Stop | N/A | YYYYMMDD_HHMMSS |
| 0 | ProcessingData | Corner_Coord; WindData; StatisticsReport; List_of_ships | - |
| 1 | Corner_Coord | SARData_Sample; SARData_Line; Scene_Sample; Scene_Line; Latitude; Longitude | - |
| 2 | SARData_Sample | N/A | Number of columns of 512 pixels in the geocoded image |
| 2 | SARData_Line | N/A | Number of rows of 512 pixels in the geocoded image |
| 2 | Scene_Sample | N/A | |
| 2 | Scene_Line | N/A | |
| 2 | Latitude | N/A | Latitudes of corners |
| 2 | Longitude | N/A | Longitudes of corners |
| 1 | WindData | Direction; Speed | - |
| 2 | Direction | N/A | Wind direction over the patch |
| 2 | Speed | N/A | Speed direction over the patch |
| 1 | StatisticsReport | Number_of_ships | - |
| 2 | Number_of_ships | N/A | Number of detected ships in the SAR image |
| 1 | List_of_ships | Ship | - |
| 2 | Ship | Name; Centroid_Position; Size; BoundingBox | - |
| 3 | Name | N/A | String with the ID of the ship |
| 3 | Centroid_Position | Latitude; Longitude; SARData_Sample; SARData_Line; Scene_Sample; Scene_Line | - |
| 4 | Latitude | N/A | Latitude coordinate of the ship centroid |
| 4 | Longitude | N/A | Longitude coordinate of the ship centroid |
| 4 | SARData_Sample | N/A | Column coordinate of the ship centroid (patch) |
| 4 | SARData_Line | N/A | Row coordinate of the ship centroid (patch) |
| 4 | Scene_Sample | N/A | Column coordinate of the ship centroid (scene) |
| 4 | Scene_Line | N/A | Row coordinate of the ship centroid (scene) |
| 3 | Size | N/A | Ship length size in m |
| 3 | BoundingBox | Top; Left; Bottom; Right | - |
| 4 | Top | N/A | Top row of the detected pixels |
| 4 | Left | N/A | Left column of the detected pixels |
| 4 | Bottom | N/A | Bottom row of the detected pixels |
| 4 | Right | N/A | Right column of the detected pixels |
Data partitions
The data relating to this case study are organised as follows:
| Vessel use-case | XML labels | L0 patches | SLC patches | GRD patches |
|---|---|---|---|---|
| Train set | 2671 | 5342 | 5342 | 5342 |
| Val set | 311 | 622 | 622 | 622 |
| Test set | 1065 | 2130 | 2130 | 2130 |
| Total patches | 4047 | 8094 | 8094 | 8094 |
Note: XMLs denote the number of unique patches. L0, SLC, and GRD are doubled as they include both VV and VH polarisations.