OpenSAR Insight
From space to action: AI-powered satellites detecting floods, dark vessels, and radio interference instantly
SAR imagery
This dataset uses Synthetic Aperture Radar (SAR) images from the European Space Agency's (ESA) Copernicus Sentinel-1 mission, which come from two satellites (Sentinel-1A and Sentinel-1B) in polar orbit that operate in all weather conditions, both day and night. The selected Level 1 SAR products are Ground Range Detection (GRD) in wide interferometric mode (IW) and Single Look Complex (SLC) burst products. An important new feature of this dataset is the availability of Level 0 data (L0, RAW data) extracted from the Level 1 data (L1) used.
SAR images location
The SAR data composing the database have the following geographical coverage:
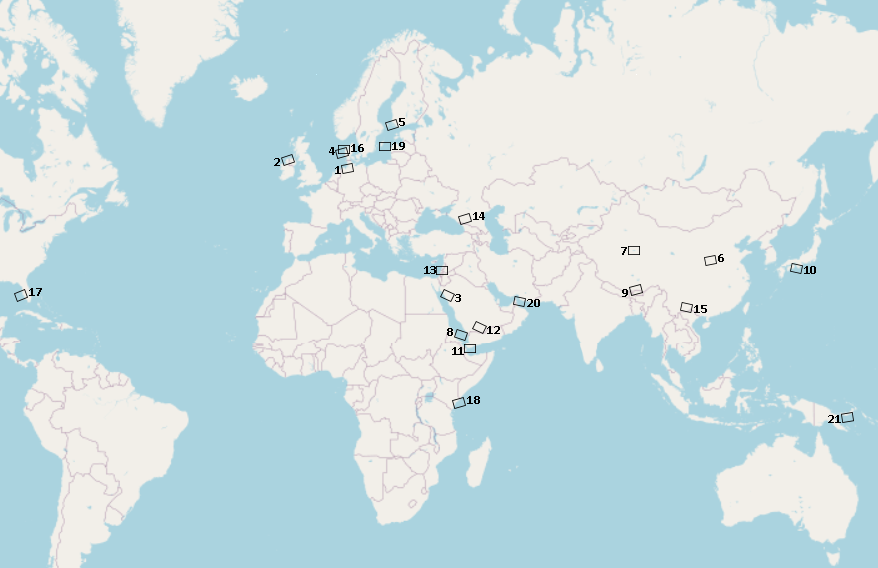
| Product ID | Location |
|---|---|
| Scene 1 | North of Germany |
| Scene 2 | Irland |
| Scene 3 | Western Saudi Arabia |
| Scene 4 & Scene 16 | Denmark |
| Scene 5 | Findland |
| Scene 6 | Eastern of China |
| Scene 7 | Western of China |
| Scene 8 | Western of Saudi Arabia |
| Scene 9 | Western of China |
| Scene 10 | Japan |
| Scene 11 | Western of Yemmen |
| Scene 12 | South of Saudi Arabia |
| Scene 13 | Damascus - Beirut |
| Scene 14 | Georgia |
| Scene 15 | South of China |
| Scene 17 | Florida |
| Scene 18 | Kenia |
| Scene 19 | Western of Latvia |
| Scene 20 | Dubai |
| Scene 21 | Papua New Guinea |
SAR Data & labeling
The dataset is structured as a series of SAR scenes. In this case study, a total of 21 different SAR scenes were selected. The data provided by Aresys has been used to carry out the selection of SAR products. This reference database provides information on radio frequency interference (RFI) maps and classification, derived from C-band measurements acquired by Sentinel-1. The data are generated for each Sentinel-1 orbit cycle, which has a repeat period of 12 days. The available data spans the period between June 2019 and September 2023.
Due to the complexity of processing SLC images, which are organized by bursts, it was necessary to modify the patch generation algorithm compared to the other use cases. In this case, square divisions were made by considering the start and end of each burst that forms each band of the SLC product. The dataset provided keeps these in the 1400x1400 to 1600x1600 range, though they can be pooled or compressed as needed to accommodate ML model input sizes.
All the patches generated are identified by patch number, product type, and polarization.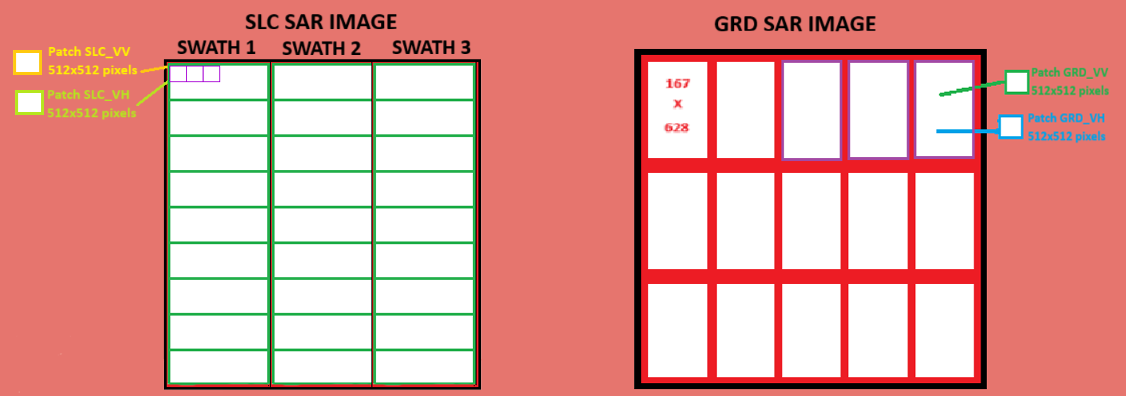
The labelling strategy is based on XML (Extensible Markup Language) format. The following Table considers tags, levels, and descendants for all RFI files (including metadata, data, and labels).
| Level | Tag Name | Descendants | Tag Contents |
|---|---|---|---|
| 0 | Scene_Info | Scene_ID; Date; Version; CaseStudy |
- |
| 1 | Scene_ID | N/A | Naming of the SAR scene into the database |
| 1 | Date | N/A | YYYYMMDD |
| 1 | Version | N/A | Version of the SAR scene |
| 1 | CaseStudy | N/A | RFIDetection |
| 0 | SARData | SAR_Mission; SARProduct; SLCSwath; Time_interval |
- |
| 1 | SAR_Mission | N/A | S1A-SA1B |
| 1 | SARProduct | N/A | Name of the SLC product SAR |
| 1 | SLCSwath | N/A | Number of swath |
| 1 | Time_Interval | Start; Stop |
- |
| 2 | Start | N/A | YYYYMMDD_HHMMSS |
| 2 | Stop | N/A | YYYYMMDD_HHMMSS |
| 0 | ProcessingData | Corner_Coord; Corner_Coord_Mask; StatisticsReport |
- |
| 1 | Corner_Coord | SARData_Sample; SARData_Line; Scene_Sample; Scene_Line; Latitude; Longitude |
- |
| 2 | SARData_Sample | N/A | Number of columns of 512 pixels in the geocoded image. |
| 2 | SARData_Line | N/A | Number of rows of 512 pixels in the geocoded image. |
| 2 | Scene_Sample | N/A | |
| 2 | Scene_Line | N/A | |
| 2 | Latitude | N/A | Latitudes of corners |
| 2 | Longitude | N/A | Longitudes of corners |
| 1 | Corner_Coord_Mask | Sample; Line |
- |
| 2 | Sample | N/A | Number of columns of patch mask |
| 2 | Line | N/A | Number of rows of patch mask |
| 1 | StatisticsReport | RFIDetection | - |
| 2 | RFIDetection | N/A | Whether an RFI event may be detected in the patch. |
Data partitions
The data relating to this case study are organised as follows:
| RFI use-case | XML labels | Masks | L0 patches | SLC patches | GRD patches |
|---|---|---|---|---|---|
| Train set | 824 | 824 | 1648 | 1648 | 1648 |
| Val set | 129 | 129 | 258 | 258 | 258 |
| Test set | 94 | 94 | 188 | 188 | 188 |
| Total | 1047 | 1047 | 2094 | 2094 | 2094 |
Note: XMLs denote the number of unique patches. For this use-case, masks are included. L0, SLC, and GRD are doubled as they include both VV and VH polarisations.